
80/20 Rule in
Economy
See Economic Leverage in the Vital Few
The economy does not move like one tidy average. The 80/20 rule is a quick reminder that a small part of a system often explains a large part of the result, and in economics that small part might be asset owners, exporters, metro areas, banks, or shipping chokepoints. If you only watch the headline number - GDP growth, inflation, unemployment - you can miss the few places where power, risk, and opportunity are actually concentrated.
This article uses the 80/20 lens to read those concentrations. You will see why wealth is more concentrated than income, how a tiny share of exporting firms can create most export value, why a minority of metro areas produces most U.S. output, and why regulators watch a short list of banks so closely. None of these ratios is magic. They are clues: find the vital few first, then decide whether the smart move is to support the engine, widen access, or build protection around a chokepoint.
Why Wealth Is More Concentrated Than Income
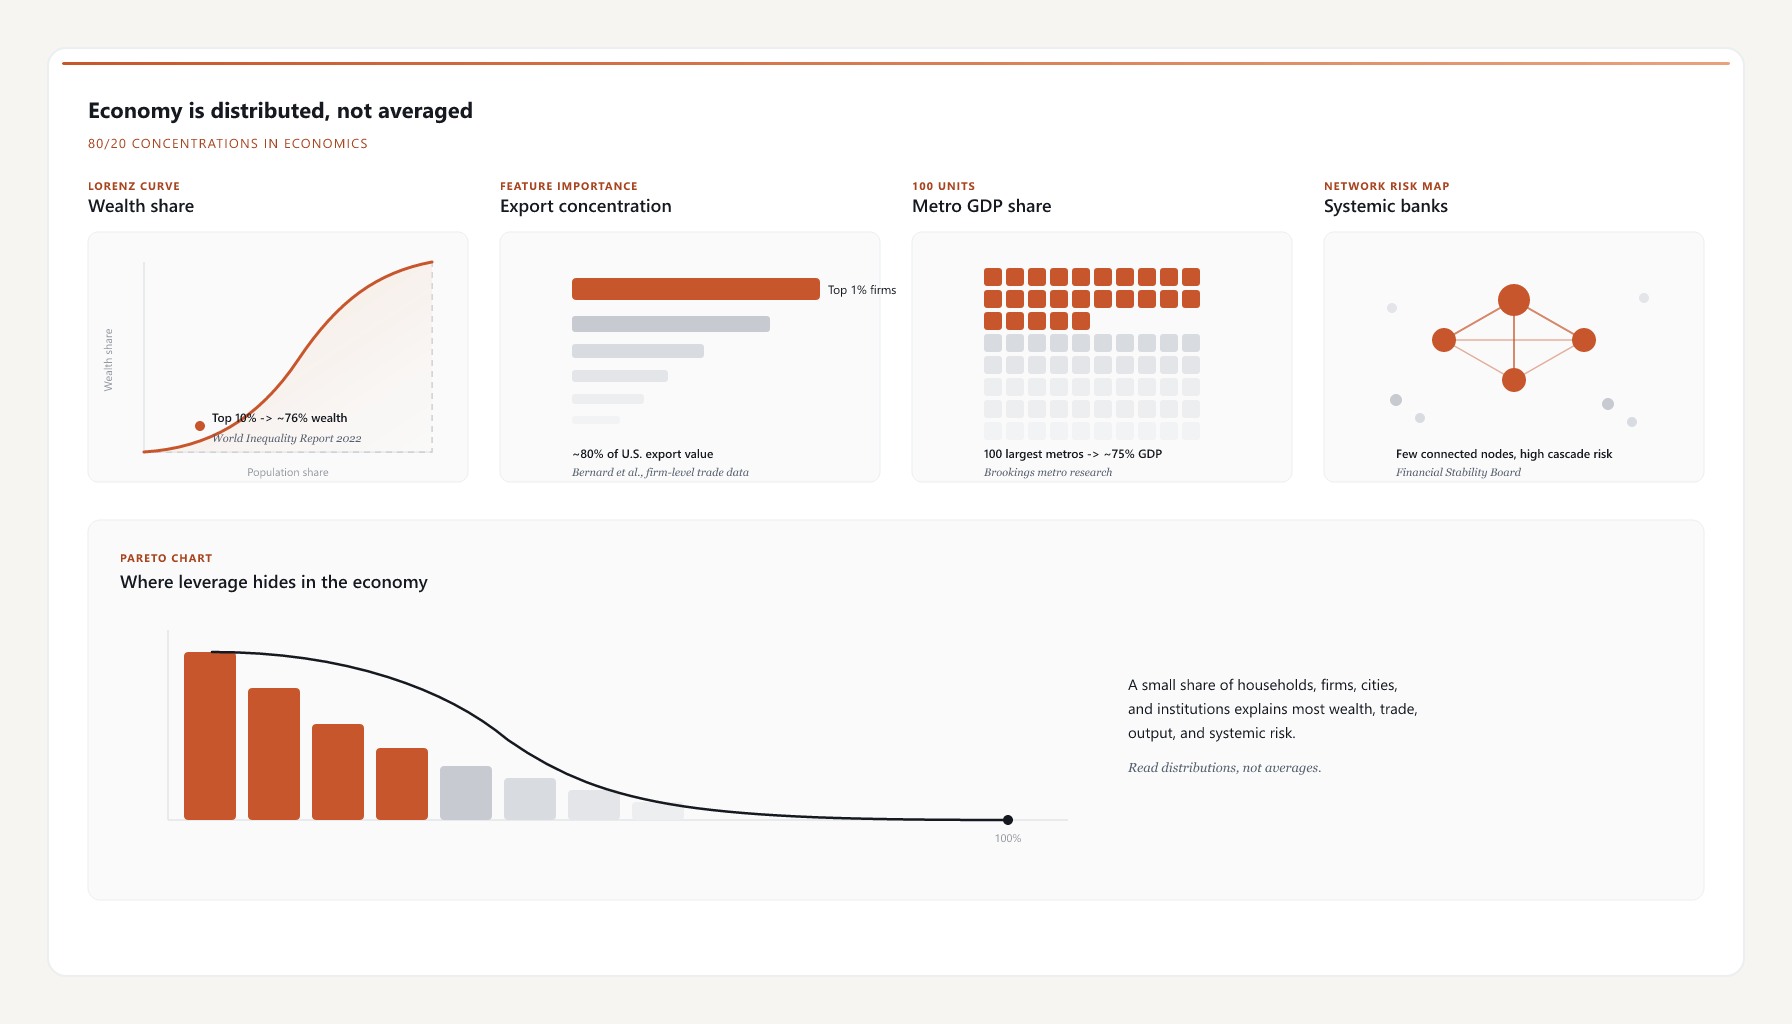
Income and wealth are often discussed together, but they behave differently. Income is a flow: wages, business profits, dividends, rent, interest. Wealth is a stock: houses, shares, bonds, businesses, land, retirement accounts, and debt netted out. Wealth concentrates faster because assets earn returns, rise in price, and can be inherited. The World Inequality Report 2022 estimated that the top 10% of adults receive about 52% of global income, while owning about 76% of global wealth. That is the cleanest economic “aha” in this topic: inequality is not just about paychecks. It is about who owns the machines, code, property, brands, and financial assets that keep producing income after the workday ends.
In the United States, Federal Reserve distributional data tells a similar story. Around 2022, the top 10% of families held roughly two-thirds of household wealth, while the bottom half held only a small single-digit share. The exact figure moves with asset prices, but the pattern is stable enough to shape housing, retirement, campaign finance, and consumption.
80/20 example: The World Inequality Report 2022 put the global top 10% at roughly 76% of wealth ownership. That is not exactly 20/80, but it is close enough to show the same mechanism: a minority of asset owners controls most balance-sheet power.
8020 move: When judging an economy, look at wealth shares alongside GDP per person. Start with top 10%, middle 40%, and bottom 50% wealth shares before forming an opinion about fairness or stability. For a deeper view of this specific pattern, the site’s article on wealth distribution is the closest companion to this one.
80/20 Rule Example: The Top 1% of Exporters
The “average business” is a poor guide to how modern economies grow. Most firms are small, local, and not especially productive. A much smaller set sells across borders, invests heavily in technology, hires specialized workers, and builds supply chains that smaller firms cannot easily copy. Economists Andrew Bernard, J. Bradford Jensen, Stephen Redding, and Peter Schott, using U.S. firm-level trade data, showed how extreme export concentration can be. In U.S. data around 2000, the top 1% of exporting firms accounted for roughly 80% of U.S. export value. That is a striking version of the 80/20 pattern, and it is not because the other 99% are useless.
Exporting has fixed costs: compliance, logistics, foreign distribution, financing, language, legal risk, and customer support across time zones. Scale helps: a large firm can spread regulatory and logistics costs over many units. Intangibles compound: software, patents, brands, and data get more valuable when used across many markets. Networks reinforce winners: suppliers, distributors, and skilled workers cluster around firms that already have demand.
80/20 example: In U.S. exporter research, about 1% of exporters generated around 80% of export value. The vital few were not just bigger versions of normal firms; they operated with different capabilities.
8020 move: A founder should ask which capability could move the company from local seller to scalable exporter: certification, distribution, enterprise sales, or a repeatable production process. A policymaker should not spread every support program evenly across all firms. Some money should improve broad basics, but growth policy also needs to identify the firms and sectors with realistic export or productivity potential. If you run or study companies, connect this to the article on business: the same pattern shows up inside firms, where a few products, customers, or channels usually explain most profit.
Largest Metro Areas and Their Share of U.S. GDP
People sometimes talk as if jobs can be moved anywhere once there is broadband. Some can. Many cannot, because cities create what economists call agglomeration economies: deep labor markets, nearby suppliers, faster knowledge spillovers, better matching between specialized workers and firms, and more chances for accidental learning. Brookings research has repeatedly noted that the 100 largest U.S. metropolitan areas contain about two-thirds of the population and produce roughly three-quarters of U.S. GDP. That is not a perfect 20/80 split, but it shows the direction clearly: national growth is heavily shaped by a minority of places.
There is a catch. When productive cities restrict housing too tightly, the gains get trapped in land prices and rents. The city still looks rich, but new workers cannot move in easily, and lower-income residents get pushed outward. A high-output region can become both an engine and a bottleneck.
80/20 example: In the United States, roughly 100 large metro areas produce about 75% of GDP while holding about 66% of the population. A minority of places drives a majority of measured output.
8020 move: Do not compare “the economy” only at the national level. Pull up job growth, wage growth, housing costs, and business formation for your city or region. For career choices, this reveals whether your best move is relocation, remote access to a stronger labor market, or building a niche where you already live.
Systemically Important Banks and Concentration Risk
Financial systems look broad because they contain thousands of banks, funds, insurers, payment companies, and markets. But crises often travel through chokepoints: highly connected banks, short-term funding markets, large clearing houses, government bond markets, or a commodity price that sits underneath many contracts. The Financial Stability Board’s global systemically important bank list usually contains fewer than 35 banks. That is tiny compared with the number of banks in the world, yet regulators pay special attention to them because their failure could transmit stress across borders.
The mechanism is not mysterious: leverage magnifies losses, maturity mismatch turns small doubts into funding runs, and interbank connections spread fear faster than balance sheets can be checked. The 2008 crisis made this concrete. Lehman Brothers was one institution, but its bankruptcy hit money market funds, derivatives counterparties, repo funding, confidence in other investment banks, and the real economy. The lesson was not “one firm caused everything.” It was that a few nodes sat in places where losses could cascade.
80/20 example: Fewer than three dozen banks can receive global systemic importance labels in a world with thousands of banks. A very small share of institutions can account for a large share of financial-system attention because connectivity matters as much as size.
8020 move: Map your top three financial exposures: employer, mortgage or rent, investment portfolio, business customers, or debt rate. Then ask what happens if interest rates, energy prices, or one major counterparty moves against you. Investors can pair this with investing and risk management: concentration is not always bad, but unrecognized concentration is how small shocks become personal disasters.
The Best Economic Questions Look for the Binding Constraint
The 80/20 view should not become an excuse to worship winners or ignore everyone else. The real value is diagnostic. If a few households hold most assets, the lever might be tax design, housing access, retirement saving, inheritance rules, or broad asset ownership. If a few firms drive exports, the lever might be competition policy, infrastructure, skills, or financing for firms just below the frontier. If a few cities drive growth, the answer is not simply “fund the winners.” It might be better rail links, looser housing rules, university commercialization, or digital infrastructure that lets smaller regions connect to larger markets. If a few banks or markets carry systemic risk, the answer is targeted capital buffers, stress tests, liquidity rules, and credible resolution plans.
A simple way to use this today is to make a four-line concentration map: Households: Who owns the assets, and who depends mostly on wages? Firms: Which companies create most exports, jobs, profits, or R&D? Places: Which cities or regions are pulling ahead, and why? Risks: Which institutions, prices, or markets could spread trouble fastest? That map is more useful than a single headline GDP number. GDP growth can look healthy while household balance sheets weaken, regional gaps widen, or financial risk builds quietly in one corner.
Read the Economy by Its Concentrations
The economy is shaped by averages, but it is often explained by concentrations. Wealth is more concentrated than income. Export power sits inside a small group of capable firms. Output clusters in major metro areas. Financial danger collects around a few connected nodes. That does not mean the same people, firms, or cities should always get more attention. It means serious analysis starts by locating the vital few and then asking what to do about them. Sometimes the right move is to support the engine. Sometimes it is to tax the rent. Sometimes it is to open access. Sometimes it is to build buffers around the chokepoint before it breaks. The 80/20 habit in economics is simple: before arguing about policy, investing, career moves, or business strategy, find the distribution. The leverage is usually hiding in the part of the chart that the average has smoothed away.