
80/20 Rule in
Fashion Trends
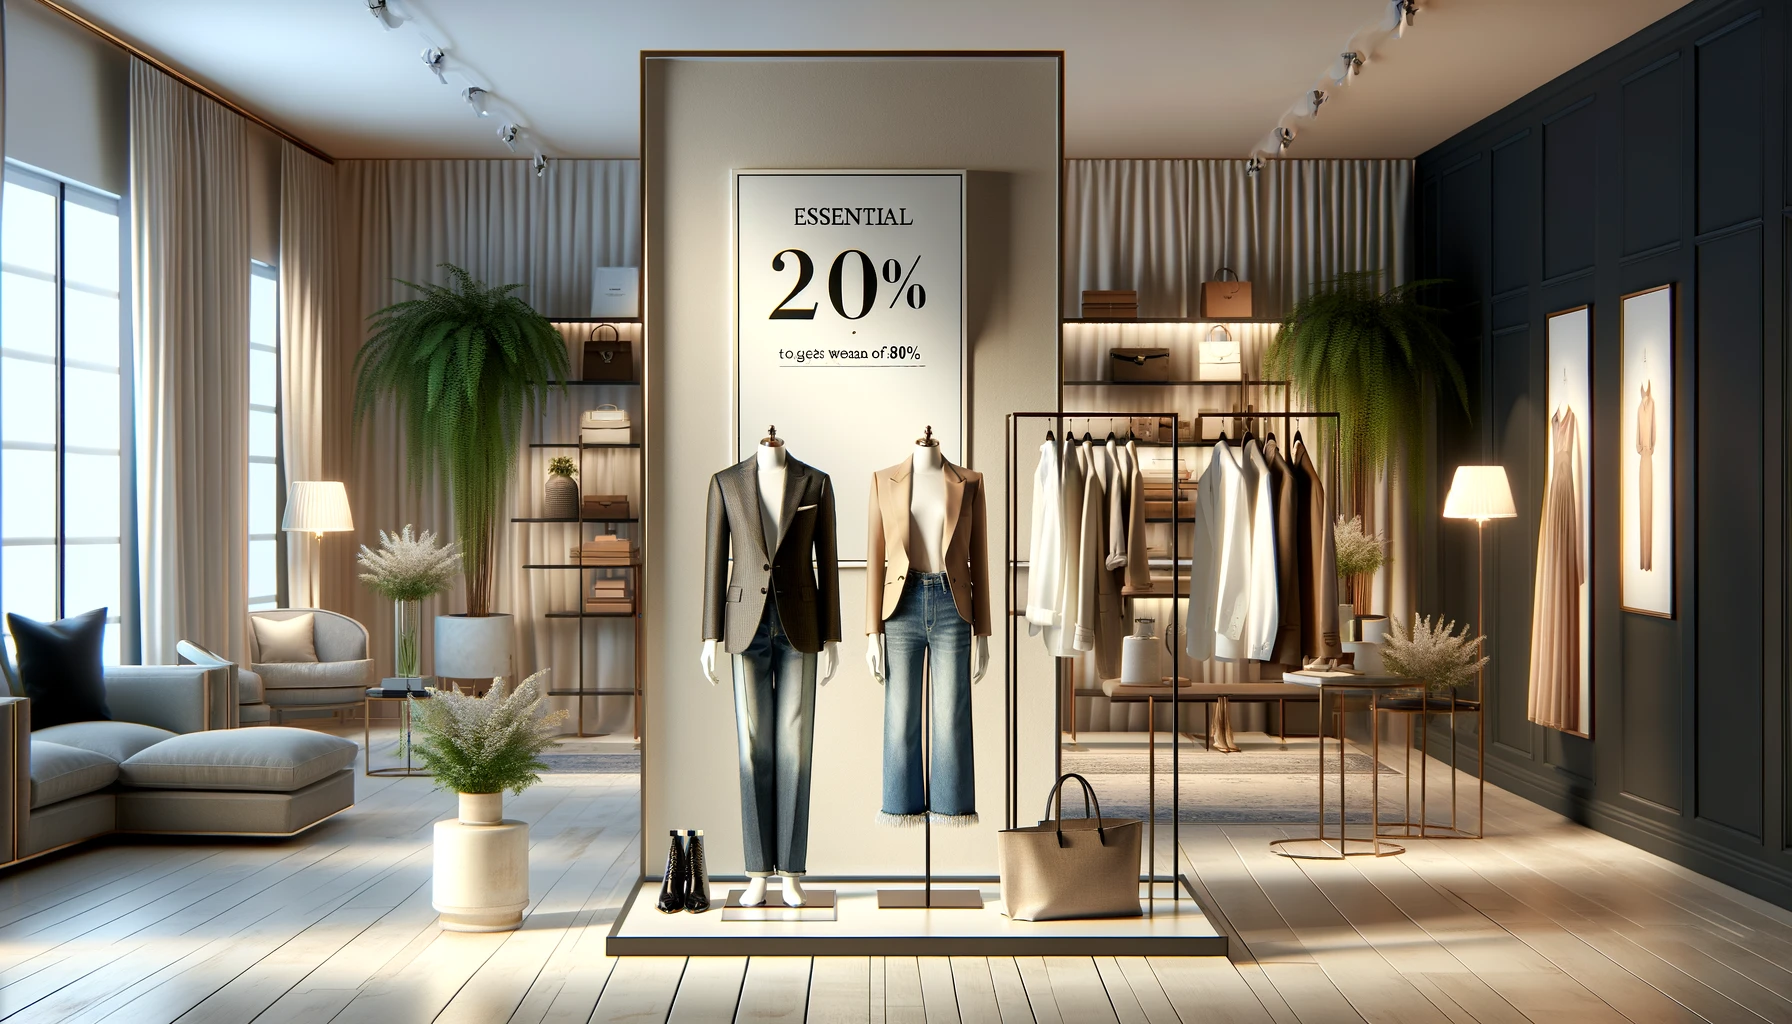
Most closets have more clothes than they need and still feel like they have nothing to wear. Look through any bedroom closet and you will notice a pattern: a handful of pieces get pulled out every week while a third of the hangers hold clothes worn twice a year, if that. Retailers see the mirror image of this from the other side of the counter, with markdown racks piling up next to a few styles that sell out before the season is half over.
That gap between what gets owned or stocked and what actually gets worn or bought is the 80/20 rule showing up in fabric and thread. A small share of garments, SKUs, trend signals, and customers drives most of what matters in fashion, whether you are filling a closet or filling a store. Spot those four levers and you stop guessing at what to buy, stock, or design next.
The Handful of Garments Doing All the Work
Stylists who run closet audits for clients report a consistent finding: out of a wardrobe of 40 or so pieces, usually 6 to 10 of them account for most of the outfits worn in a given month. A well-fitting pair of dark jeans, one blazer that works for two different occasions, a couple of neutral tops, and shoes that still feel fine after four hours tend to reappear constantly, while a third of the closet gets touched only a few times a year.
The number that makes this visible is cost-per-wear: the price of an item divided by how many times you actually wear it. A $200 coat worn 100 times costs $2 per wear. A $40 top worn twice costs $20 per wear, which is the worse deal even though the sticker price looks smaller.
Pull up your last 30 outfits, from memory or photos, and circle every garment that shows up more than twice. That short list is your real wardrobe, and everything outside it is either a candidate to sell or donate, or a genuine special-occasion piece you're keeping on purpose. For a fuller system on auditing what you own and buying around it, see 80/20 in Wardrobe Management.
The SKUs That Actually Pay the Bills
Retail buyers who track sell-through rate, the percentage of stock sold within a set period before markdown, usually find that a small slice of SKUs behaves nothing like the rest of the catalog. The metrics below matter more than a simple bestseller list, because raw unit sales hide how much margin, waste, and stockroom space each style is actually costing.
| Metric | What it actually tells you |
|---|---|
| Sell-through rate | How fast a style moves before you're forced to discount it |
| GMROI (gross margin return on inventory) | Whether a style earns back more than the cash tied up in stocking it |
| Size curve stockouts | Whether you're losing sales on popular sizes while overstocking slow ones |
| Return rate | Whether a "bestseller" is quietly eating its own margin through returns |
80/20 example: a boutique owner who finally ranked a 120-SKU spring collection by gross margin dollars, not units sold, found that 15 styles carried most of the season's profit. Two of the store's top sellers by unit count turned out to be barely profitable once markdowns and returns were factored in.
Rank your own line, or a retailer you're studying, by margin dollars instead of units moved, and the real top 20% usually looks different from the bestseller list. Point-of-sale software makes this an export-and-sort exercise, not a research project. See 80/20 in Inventory Management for more on running this kind of audit.
The Trend Signals Actually Worth Chasing
Every season produces dozens of trends declared by runways, blogs, and influencers, but only a few translate into real demand. The useful signal isn't which color a designer sent down a runway. It's whether search interest and buying behavior move together.
Google Trends shows rising search volume for a style term over time. Trend-forecasting services such as WGSN or the Lyst Index track which items are gaining traction across many retailers and search platforms at once, which filters out noise from a single viral post.
The gap worth watching is between attention and conversion. A style can rack up TikTok saves and comments without anyone clicking add-to-cart, while a less flashy item quietly climbs in on-site search and checkout data. If your own analytics show a search term rising for a product you don't carry yet, or an add-to-cart rate climbing on an item you nearly cut from the line, that is a stronger signal than trend-report enthusiasm alone. The same gap between attention and outcome shows up outside fashion too, which is one reason it's worth reading 80/20 in Marketing alongside this.
The Customers Who Predict What Sells Next
Not every customer is equally useful for predicting demand. Retailers who study purchase histories instead of gut feeling usually find a small segment of repeat buyers who move faster than everyone else and spend more per visit.
- Repeat buyers versus one-time discount shoppers: a customer who buys at full price and returns within 60 days signals real demand. A customer who only appears during a 40 percent off sale signals price sensitivity, not trend direction.
- Ask before you buy deep: email or survey your top 10 percent of repeat customers before committing to a new trend. This group tends to notice and adopt shifts before the wider market does.
- You don't need enterprise software: a simple purchase-history export from almost any point-of-sale or e-commerce platform is enough to find who buys the most, returns the least, and comes back within two months.
The Sustainability Moves That Cut the Most Waste
Fashion's environmental footprint doesn't spread evenly across a brand's decisions either. A handful of choices, fiber selection, dyeing and finishing processes, and how much inventory gets overproduced and never sold, drive most of the damage, while smaller gestures like reusable shopping bags barely move the number.
Overproduction is the lever most brands can control directly and immediately. Unsold inventory that gets discounted, warehoused, or destroyed represents wasted material, water, energy, and labor before a single item ever finds a buyer. Brands that size their first production run to pre-order or wholesale commitments, then reorder into proven demand instead of guessing a full season ahead, cut this waste without needing new fabric technology or a certification program.
Most of a season's leftover stock tends to come from a handful of styles nobody predicted correctly, not from every style falling short equally, which is the same pattern showing up again in a different part of the business. See 80/20 in Sustainability for how this plays out in other industries.
Make the Fashion 80/20 Review a Monthly Ritual
The useful habit is not predicting fashion perfectly. It is checking where the weight is really sitting before you spend more money, buy deeper into a trend, or keep clothes that no longer earn their space.
- Closet: if 8 pieces from a 40-piece wardrobe create most of your weekday outfits, build future purchases around those silhouettes, colors, and fabrics instead of starting from scratch every season.
- Retail floor: if 15 styles from a 120-SKU collection carry most of the margin, protect those winners with better size depth and faster reorders before adding more novelty.
- Trend calendar: if a few search terms also show add-to-cart movement, treat those as stronger buying signals than a trend that only looks loud on social feeds.
- Waste: if leftover stock keeps coming from the same type of risky style, make that category pre-order led or buy it shallow until demand is proven.
8020 move: choose one review date each month and rank one fashion decision by the metric that exposes the vital few: cost-per-wear for your wardrobe, margin dollars for stock, conversion for trends, or repeat purchases for customer signals.
Fashion will always have novelty, mood, and luck in it. The advantage comes from noticing which small set of garments, products, signals, and customers keeps doing the real work, then giving that set more of your budget and attention.